Digital Twin of the Calich Lagoon: here is the CADIT project by NeMeA Sistemi
Real-time data, 3D models and predictive scenarios for more sustainable management
This article explores and expands upon the content of the poster presented at the International Symposium on Biodiversity and Ecosystem Functions under Global Change (Alghero, 12–14 November 2025) on the CaDiT project focused on the creation of a Digital Twin of the Calich Lagoon in Alghero...
Why a Digital Twin?
The Calich lagoon is a living ecosystem: it receives fresh water from the canals and salt water from the sea, and changes with the seasons, the wind and the rain. To understand its current state and what might happen, we need to bring together a wide range of information and simulate its behaviour. A Digital Twin is precisely this: a dynamic 3D model that combines in situ measurements, satellite imagery and bathymetric surveys to assess the lagoon’s current state and provide a cloud-based model, updated almost in real time (every 15 minutes), capable of integrating diverse data and simulating climatic and anthropogenic pressures.
Where does the data come from (and what are we measuring)?
The terrestrial component is described using a regional Digital Surface Model (DSM); the aquatic component, in the MVP phase, utilises provisional bathymetry derived from spectral indices from Pléiades Neo, pending replacement with more precise data from multibeam surveys. The in situ observations are obtained from a multiparametric probe.
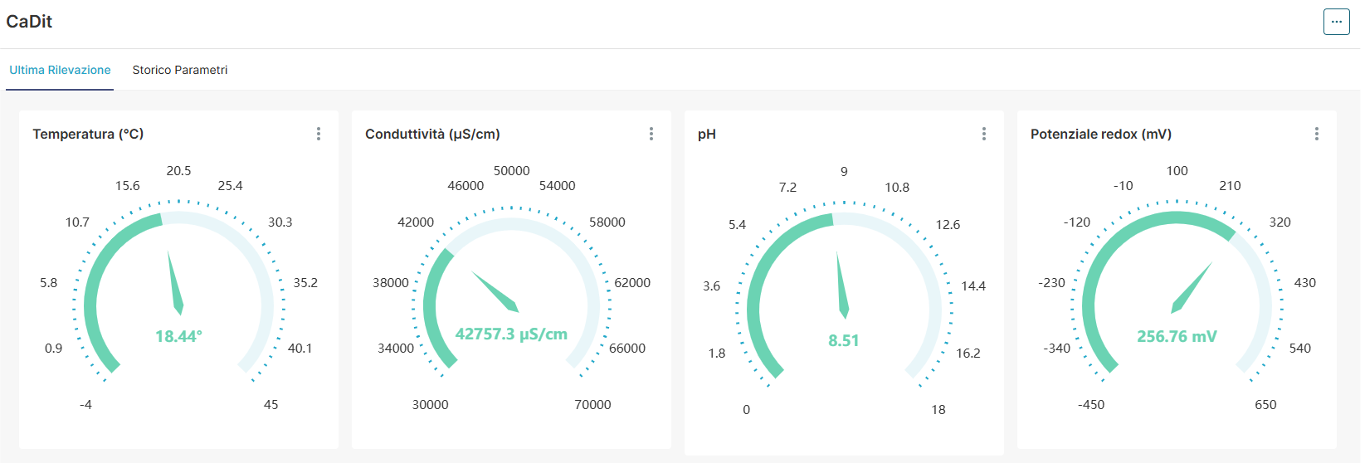
Dashboard – latest addition: Synoptic indicators for temperature, pH, ORP, conductivity and salinity for operational screening.
- Multiparameter probe: Temperature, pH, Conductivity/Salinity, Dissolved oxygen (DO), Oxidation-reduction potential (ORP), Turbidity. The data feeds into a dashboard with historical records and, once implemented, early-warning rules based on combinations of parameters.
- Earth Observation (EO) – Optical: Pléiades Neo for high-resolution (VHR) imagery (30 cm GSD)
- Planned surveys: a campaign using the HYDRA® surface drone (LiDAR & Multibeam) to obtain 3D reference data on the exposed seabed and bathymetry
How CaDiT works
The digital twin will consist of a navigable model with a GeoPortal and a dashboard (analytics and dynamic thresholds). We have completed an MVP that integrates in-situ data with remotely sensed data, a dashboard with visual analytics, and an initial demonstration of the 3D model’s information layers. Work is currently underway to strengthen the data pipelines and define the alert logic, whilst the LiDAR/Multibeam campaign is planned to consolidate the surface and seabed models.
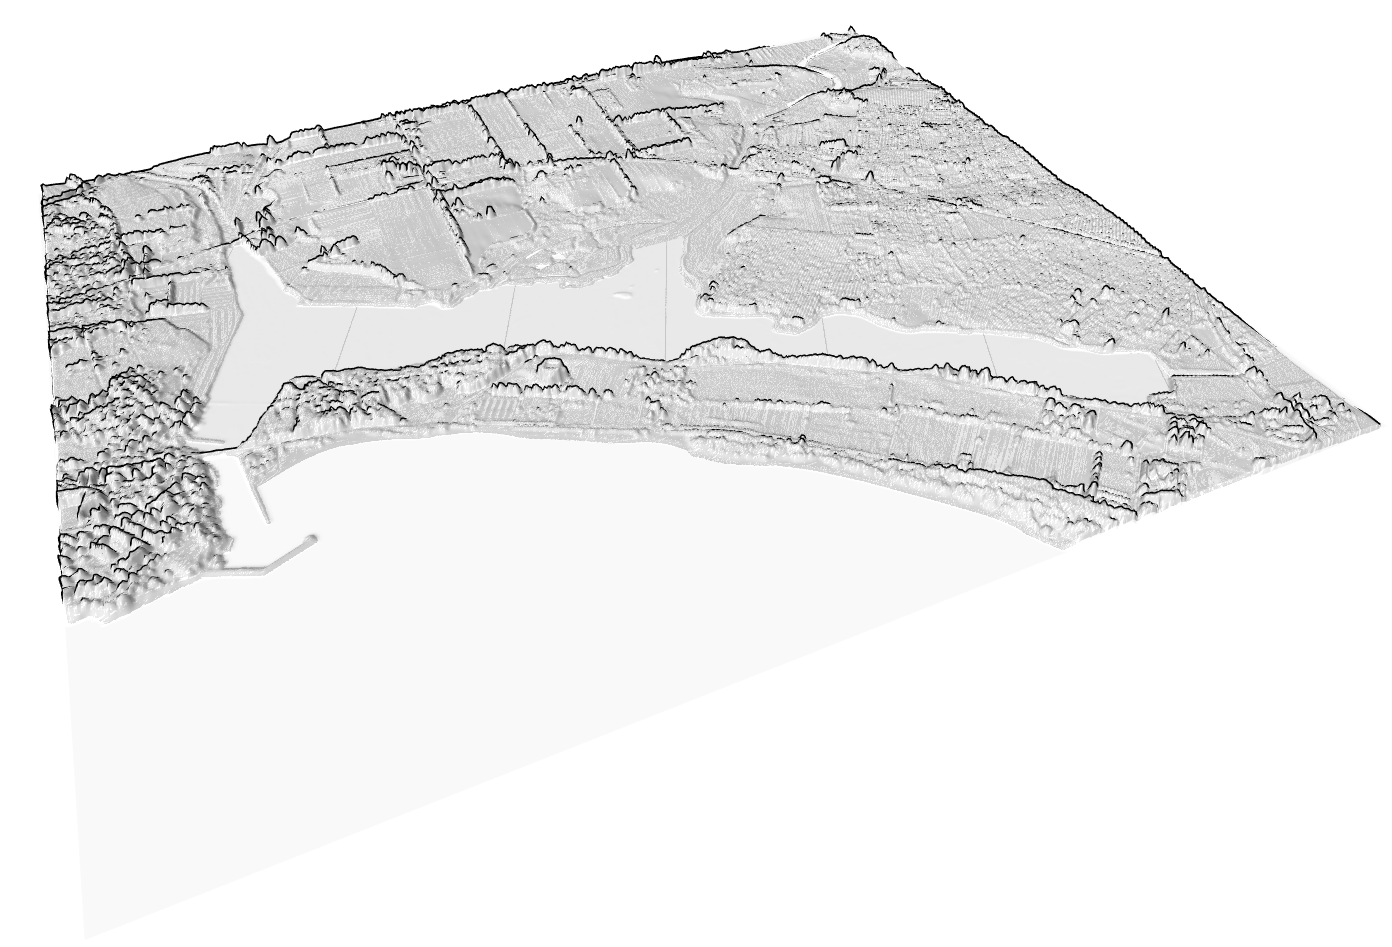
Base layer: Digital Surface Model (DSM), showing the elevations of all features on the ground (Source: Geoportal of the Autonomous Region of Sardinia).
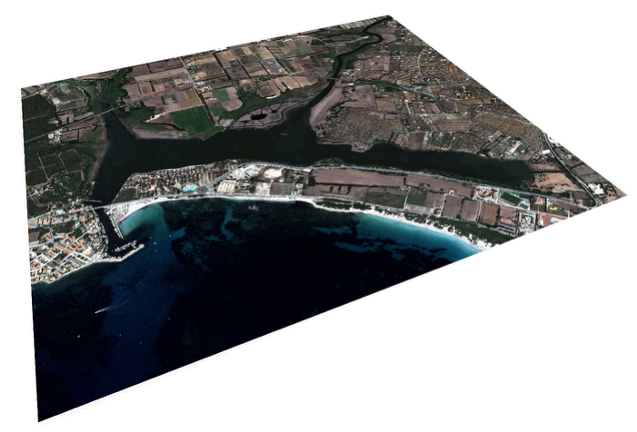
Very high-resolution satellite orthophoto: Very High Resolution (VHR) orthophoto with extremely high detail of the Calich area, used both as a 3D ‘texture’ to improve the interpretability of geographical features and to obtain provisional bathymetric data (Source: Pléiades Neo, 30 cm GSD).
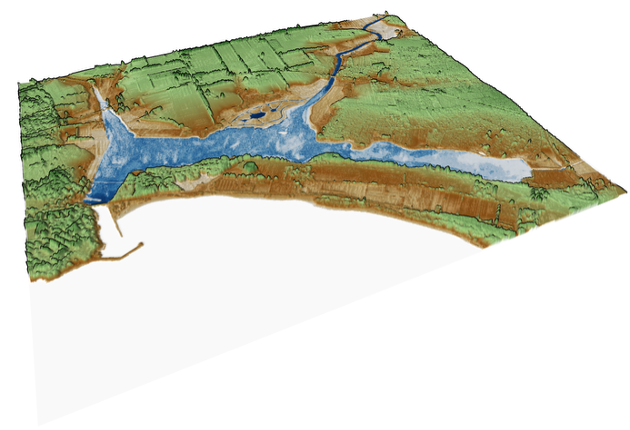
3D model (DSM + bathymetry fusion): The resampled DSM is combined with the estimated bathymetric data (Depth Index) derived from remote-sensing imagery, using the G (b2) and DB (b6) bands to produce a provisional bathymetric map, to be refined subsequently through field surveys.
Alert mechanisms: four recurring cases
Four patterns have now been formally defined, each with operational thresholds for triggering checks and mitigation measures. The thresholds are based on technical literature and local observations and will be refined as the dataset of historical time series relating to in situ measurements expands:
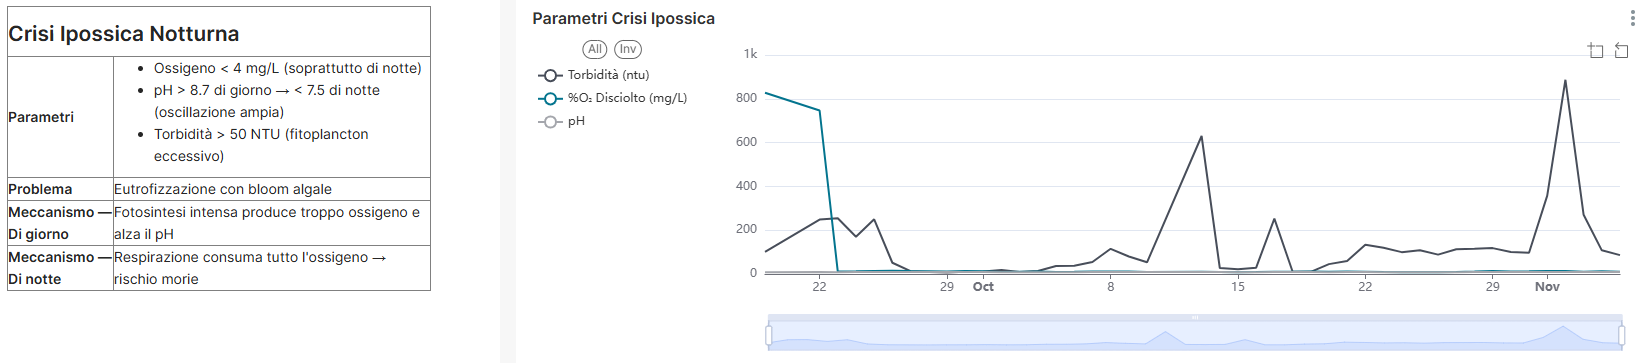
- Nocturnal hypoxic crisis: When algae produce a lot of oxygen during the day (high pH) but consume oxygen through respiration at night, dissolved oxygen (DO) levels can fall below safe levels. On the dashboard, we can observe the pH–DO fluctuation and turbidity peaks associated with phytoplankton.
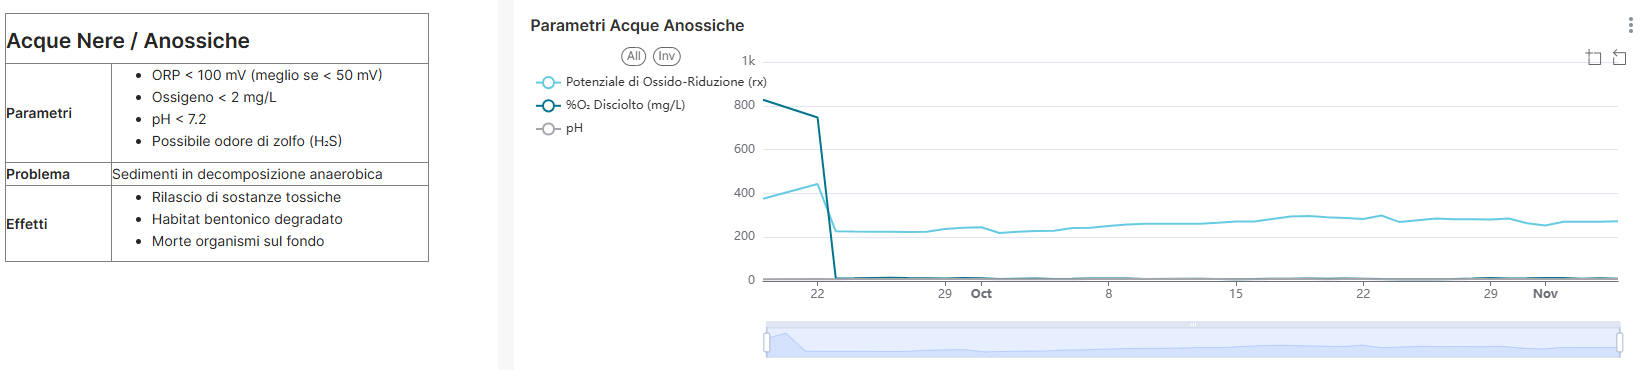
- Black/anoxic waters: Very low ORP and almost no oxygen indicate anaerobic processes in the sediments and possible sulphide releases.
- Osmotic shock caused by dilution (following rainfall): A sudden drop in salinity/conductivity can cause stress to the lagoon’s flora and fauna, leading to water stratification (freshwater above, saltwater below) and reduced water exchange in the deeper layers.
- Chronic turbidity: High NTU levels over several days reduce the amount of light reaching aquatic plants, suffocate the benthos and worsen habitat conditions.
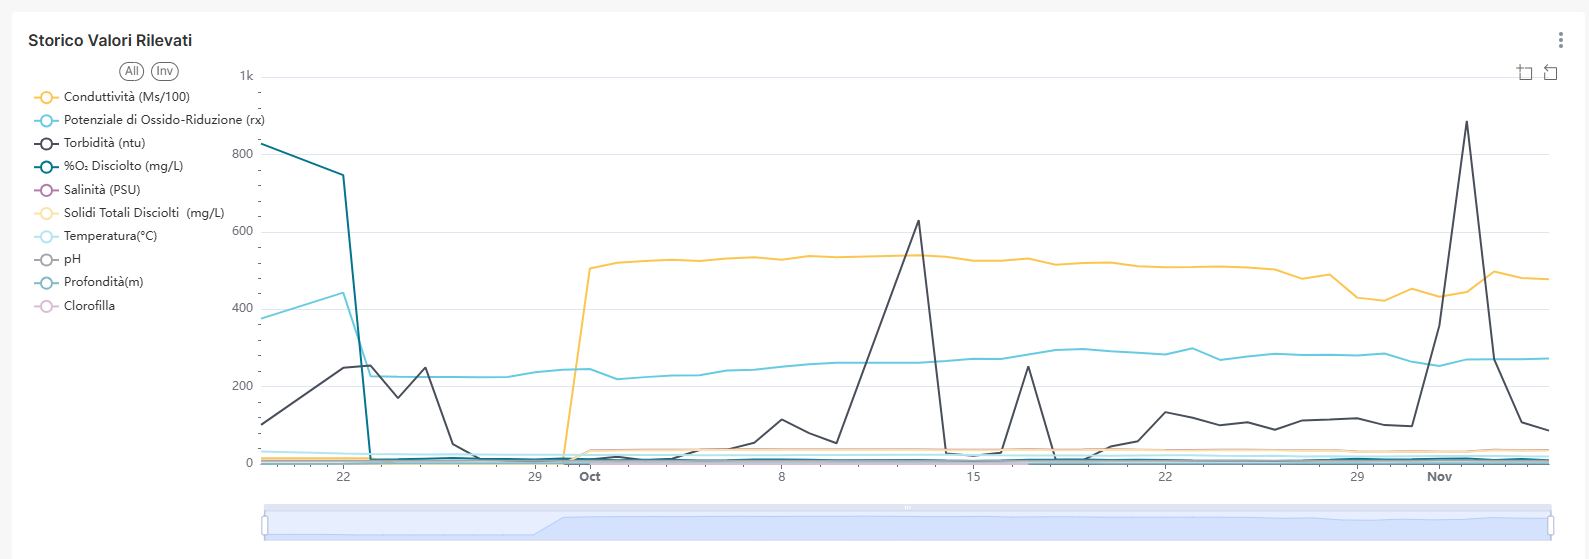
Dashboard – interactive time series: Time series for NTU, DO, ORP, salinity and T, with zoom and time-brush tools.
These categories are displayed on the dashboard via dedicated panels and time-series charts, as examples of operational tools for rapid diagnosis and prevention.
Case study – nocturnal hypoxia: Oscillatory pH–DO pattern with NTU peaks; nocturnal trigger: DO < 4 mg/L.
Case study – black/anoxic water: ORP < 100 mV (preferably < 50 mV), DO < 2 mg/L, pH < 7.2; indication of sulphate-reducing processes.
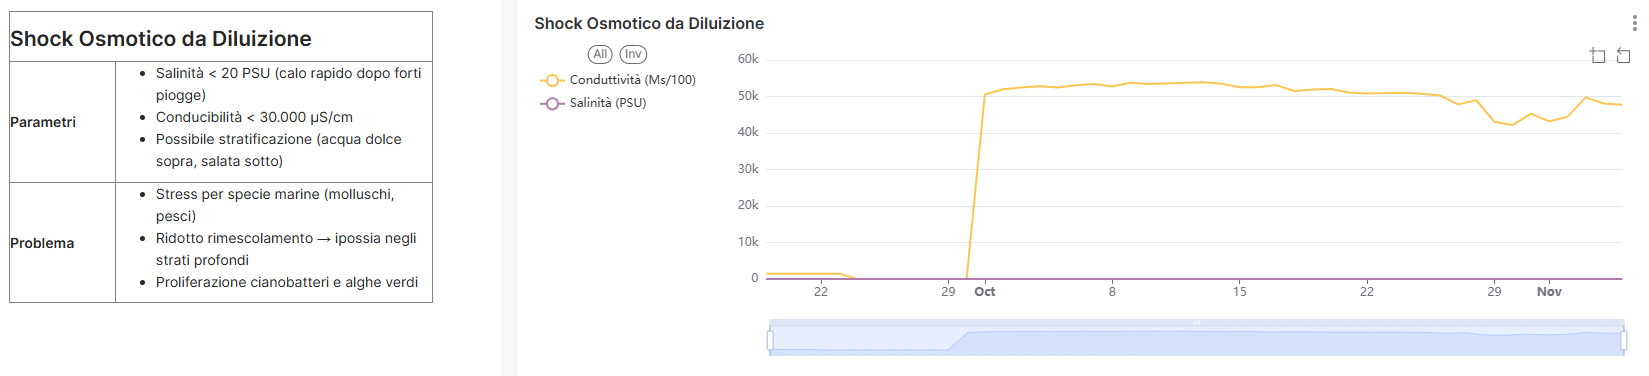
Case study – post-rain osmotic shock: Rapid drop in salinity (< 20 PSU) and conductivity (< 30,000 μS/cm) with signs of stratification.
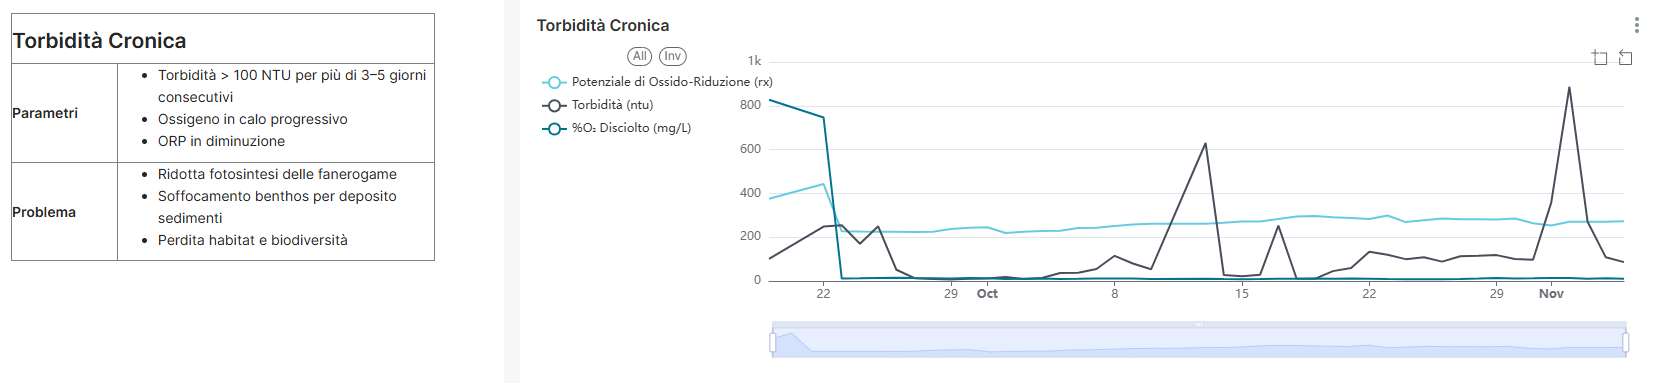
Case study – chronic turbidity: NTU levels persisting above 100 for ≥ 3–5 days and a downward trend in ORP. Risk to photosynthesis and benthos.
Expected benefits (management and conservation)
- Recognise the warning signs of a crisis in good time so that action can be taken before it is too late.
- To assess the effects of wind and tides on pH, dissolved oxygen (DO) and oxidation-reduction potential (ORP), and on water quality.
- Components and methodologies that can be reused in other Italian wetlands.
Preliminary results and future developments
The MVP demonstrates the feasibility of multi-source integration and the synoptic analysis of complex events. The dashboard, currently under development, will implement the generation of notifications when thresholds are exceeded and will offer interactive tools for temporal analysis. The depth of the lagoon (currently estimated using remote-sensing data) is an initial indication which is not a substitute for direct surveying (Multibeam and LiDAR) to be carried out in the future.
The interpretation of use cases will be enhanced by the collection of a multi-parameter time series representing the system’s recent history; for this reason, alerts will initially be ‘operational’ and must be accompanied by recommendations for field verification. The concept is designed to be transferred to other lagoons and similar ecosystems, facilitating cross-site comparisons and the establishment of shared protocols.